
In order to avoid a hairball network, we have filtered the network to show only the nodes which have at least 11 incoming and outgoing connections or edges to unique authors and recipients. In other words, the criterium to be included in this filtered network is that a person mentioned must have a total of at least eleven connections to unique correspondent (the 'in-degree') or and unique recipients (the 'out-degree'). Take Sir Edward Norris, for example, who is mentioned in eighty letters, written by five unique authors who sent letters to eight unique recipients, and because of this connection with a total of 13 unique authors/recipients Norris is included in this filtered network. We decided to set the filter at 11, for we found that a selection of 11 edges yielded a reasonable number of nodes, yet a tangled web of connections is avoided. We can say the visualization essentially represents a small number of topics addressed by a large number of correspondents.
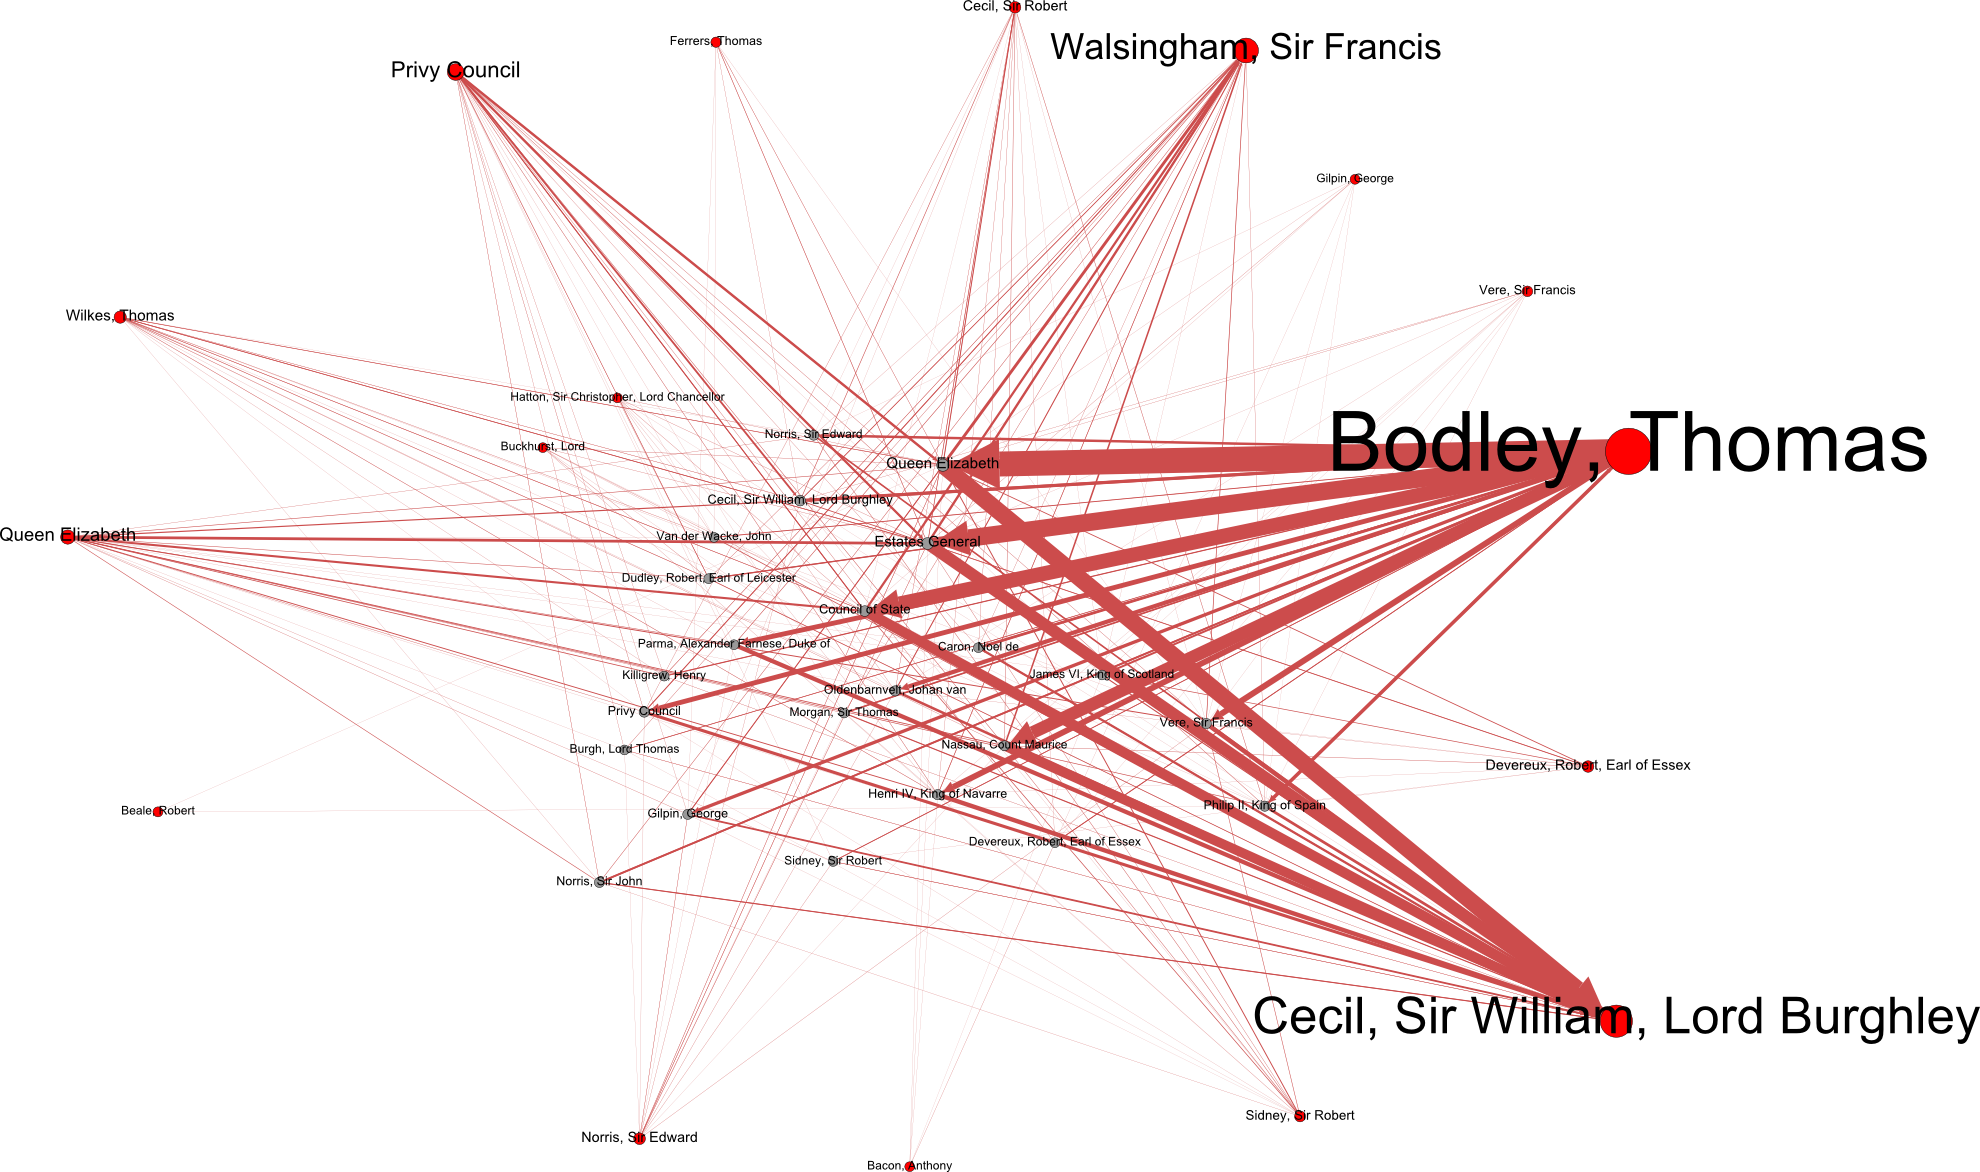
The red nodes represent authors or recipients, and the grey nodes represent people mentioned in the correspondence. The weight of the edge, the frequency with which a person is mentioned, is represented by the thickness of the line: for example, in his letters to Lord Burghley, Bodley frequently mentions Queen Elizabeth (hence the thick edge connecting Bodley to Queen Elizabeth and then to Burghley). So each letter here passes through three nodes, beginning at the author, passing through the person mentioned, and terminating at the recipient. These form two edges of a triangle.
The thick ‘edges’ denote frequency of correspondence. While the visualization does convey multiple layers of information simply and clearly, there are also caveats. Some of the limitations of the software include the flexibility of the graphic representation. In some cases, it is better to generate the connections using visualization software, and then export those results to a graphics platform in order to enhance the visual format. One issue here with the straight edges and the increased thickness of the lines is that other lines might be difficult to perceive behind them. However, while Gephi deals with this issue by using curved lines, the more dense the network, the more there is the danger of a ‘hairball’ effect.