
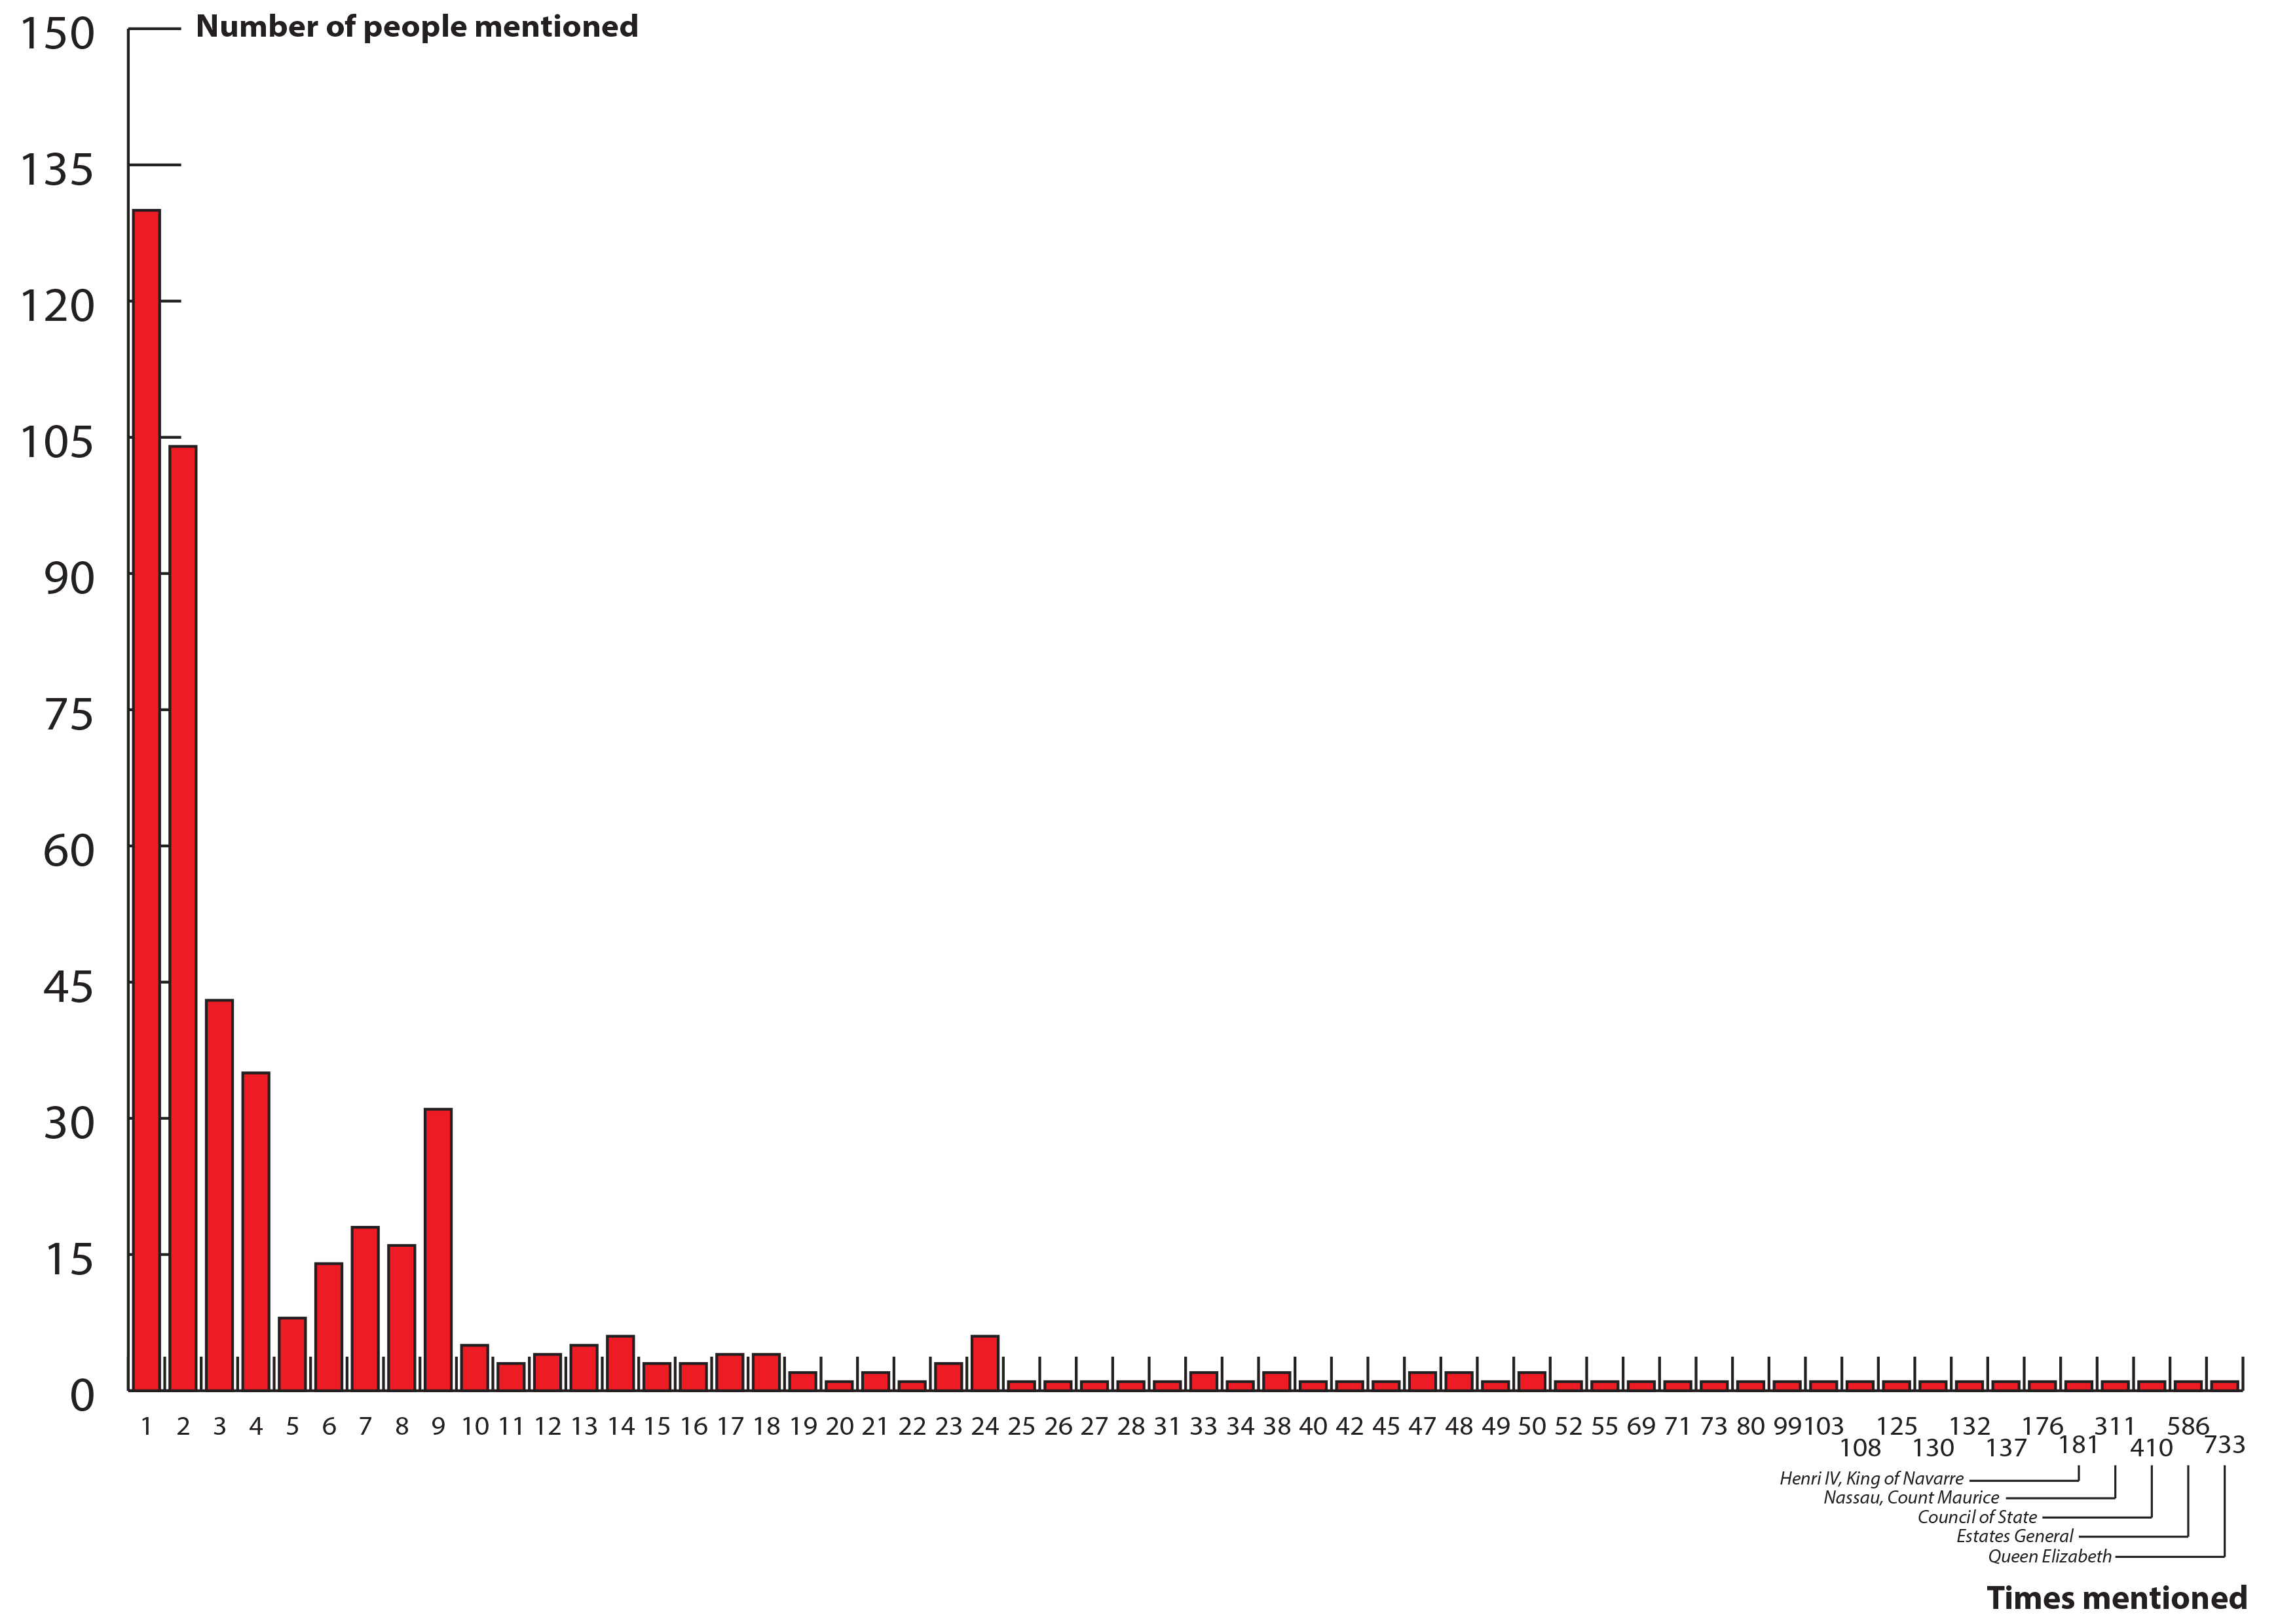
This bar graph shows how often a person is mentioned. Starting at the utmost left on the x-axis, the vast majority of the people are mentioned only once or twice, whereas one person, Queen Elizabeth, is mentioned 733 times, and the Estates General 586 times. This visualization provides insight into what extent the correspondence covers a limited set of topics widely, or, covered a range of topics briefly.