
In 1594 the town of Groningen was laid to siege by Count Maurice. Groningen, about 200km from The Hague and situated on the northeast of the country, was loyal to the Spanish. As well as numerous extant letters which document the siege, there survive four maps of Groningen commissioned by Bodley. These exquisite maps, ranging from rough drafts to water-coloured views, provide a contemporaneous sixteenth-century ‘visualization’ of the military situation as it unfolded. Despite their visual aspect, these maps are firmly situated within the correspondence project, as they were integral components of the letter-packets Bodley was sending back to England. This association of documents within a letter-packet is a fascinating elision of textual and visual material.
All images of MSS material are © British Library Board. Catalogue references are as follows: BL MS Cotton Galba DX 208r; BL MS Cotton Galba DX 204v-205r; BL MS Cotton Galba DX 206v-207r.


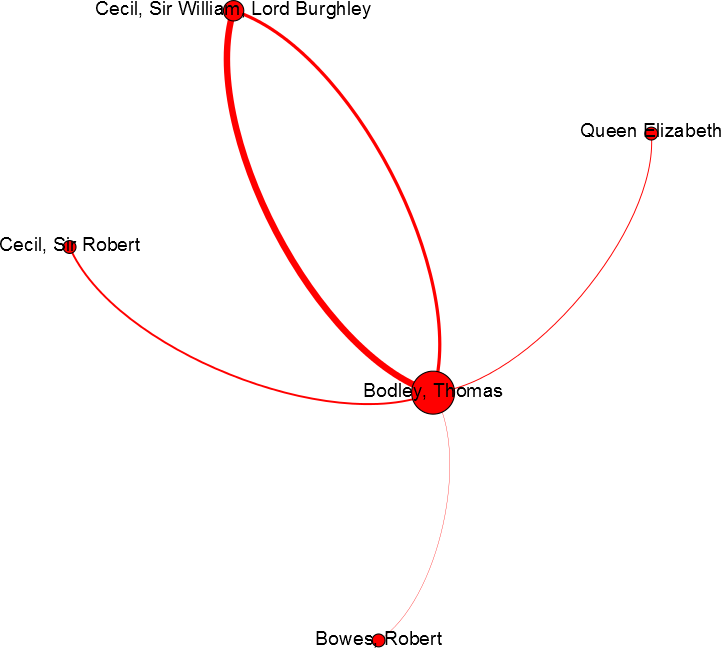
Case Study II: Groningen, mentioned in correspondence
This is a detail of the large ‘people mentioned’ network, created by visualizing the group of letters which concern the siege, and which shows all the correspondents who wrote about the siege of Groningen. This detail of the network shows the high concentration of letters concerning Groningen between Bodley and Burghley.
Case Study II: Groningen (SDL)
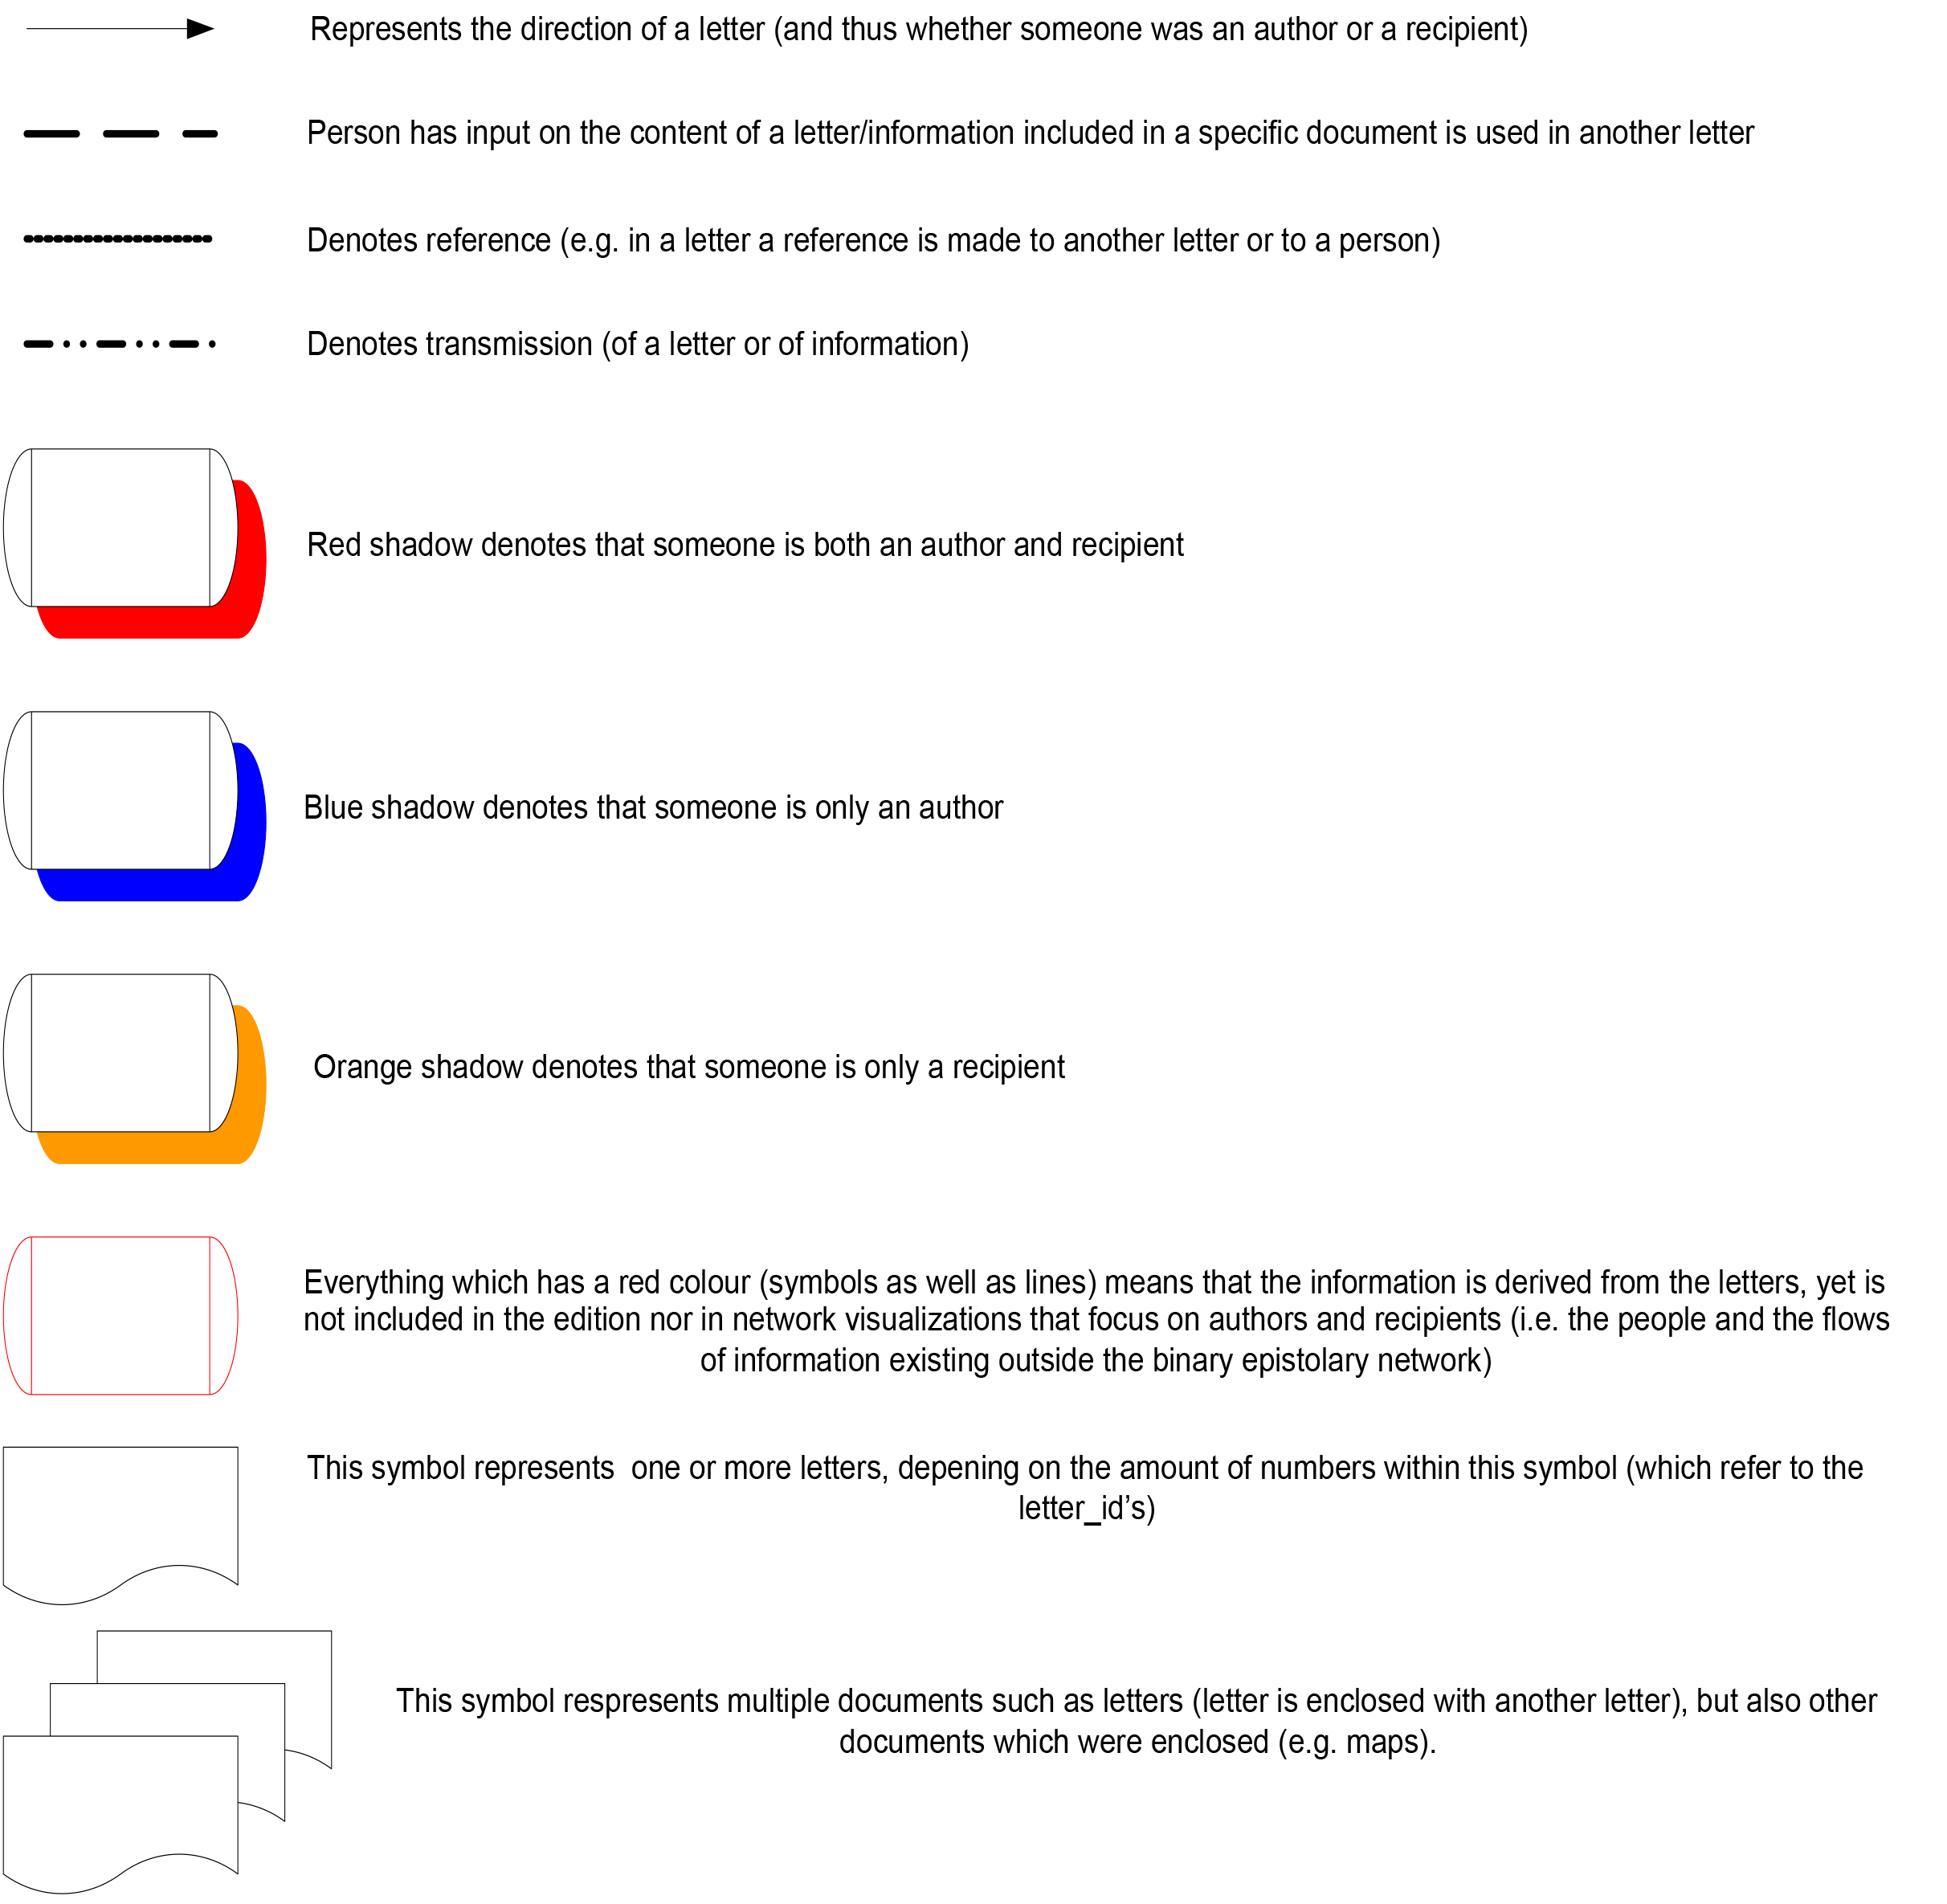
This is the SDL-diagram (Specification and Description Language ) of letters between Bodley and correspondents regarding the siege of Groningen in 1594. The syntax of the diagram is thus:
c. = copyrsp = respond to (after which the letter_id of the response letter is listed)
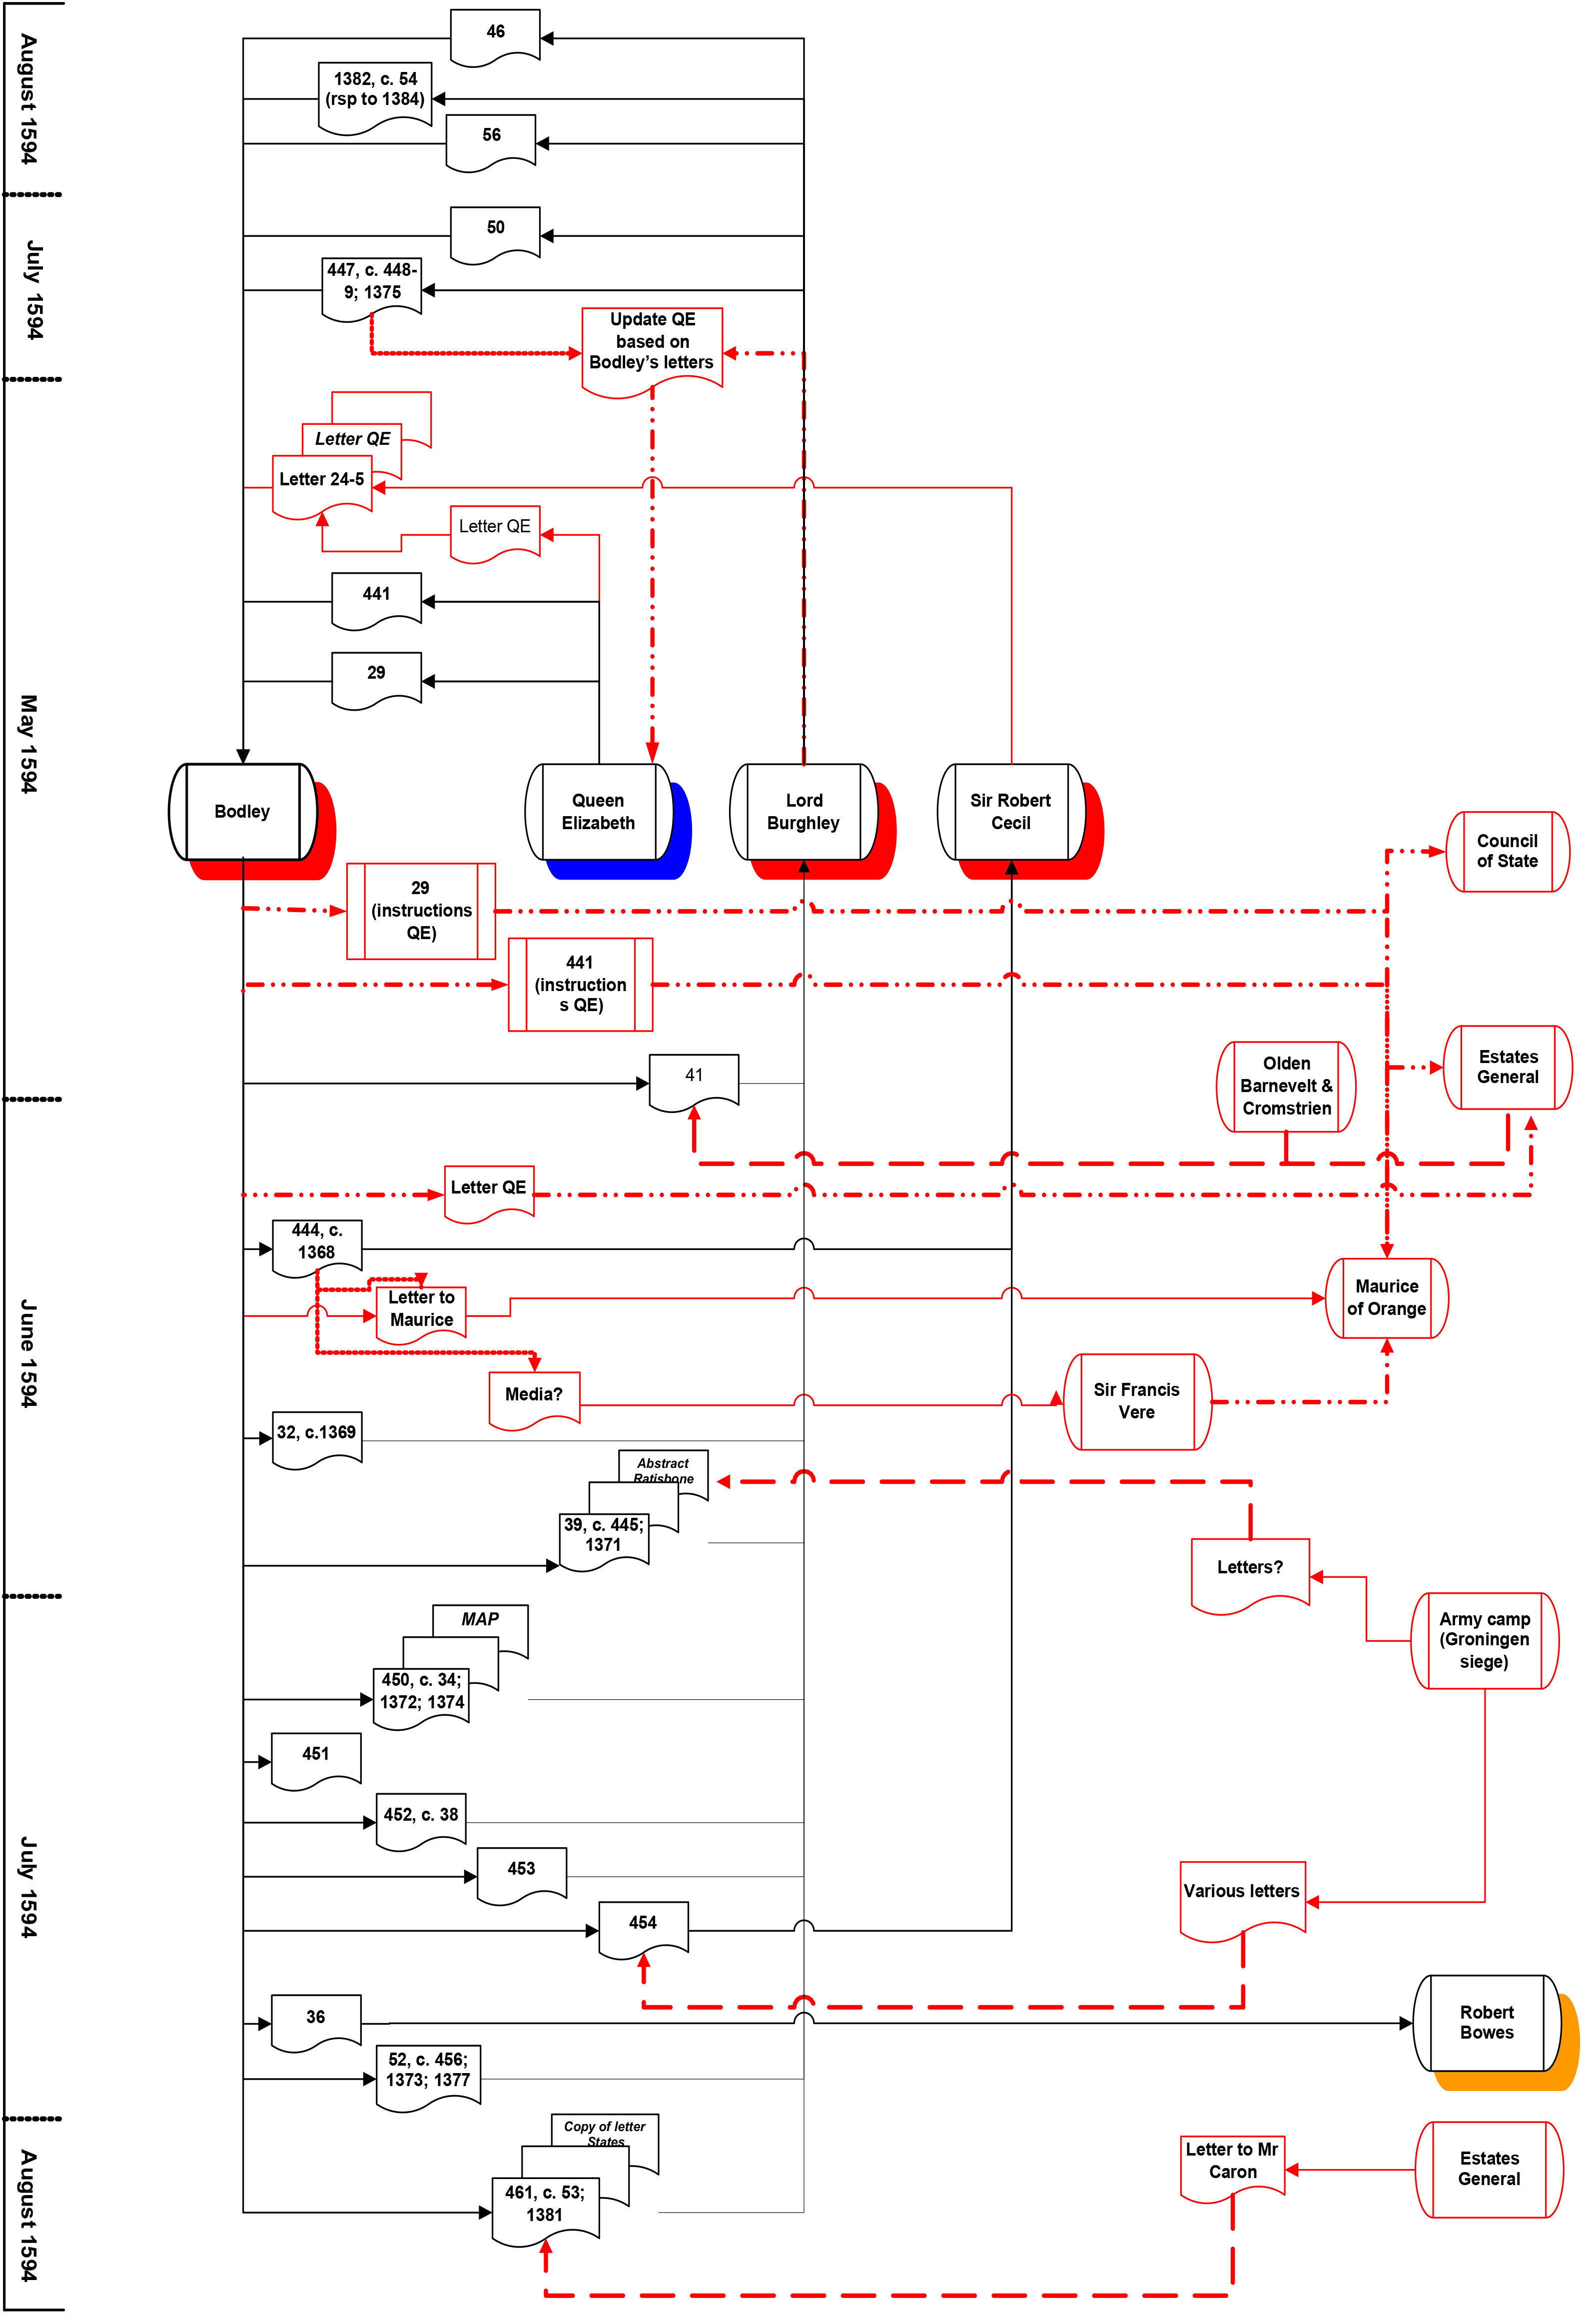
This visualization of data enables us to view the bilateral flow of information outwards from and inwards to Bodley. While the visualization requires a more involved syntax and grammar than a standard node + edges network which yields information from a brief glance, the information depicted takes the interest further. One of the attractive features of this kind of visualization method is that the contents of a single letter packet can be reconstructed. This visualization clearly depicts the map being sent with a cover letter (letter_id 0450, with copies at 0034, 1372 and 1374).
What is exciting about this method of data visualization is that it enables the reader/viewer to detect the absence of letters as well as the letters and letter-routes themselves. Note also the incorporation of the ‘Map’ into the network: this view allows for more detail than other ‘standard’ views offered by conventional data visualization models (i.e. node-link diagrams).
‘Medium’ – not sure of format in which intelligence was passed.‘Abstract’, a letter enclosure (not in the edition) sent to Burghley.
‘Update QE based on Bodley's letters' – Burghley mentions that he had sent the letters sent by Bodley until the date 7-7-1594 to Queen Elizabeth.